Sometimes when I'm working.Gantt chartI hear the words.
The side letters make it sound difficult.
The term "Gantt" invented the graph.Henry GantThe "chart" is about Mr.Figures, Tables, Graphsmeans.
In other words, the literal translation in Japanese isFigure created by Mr. Gant."It means.
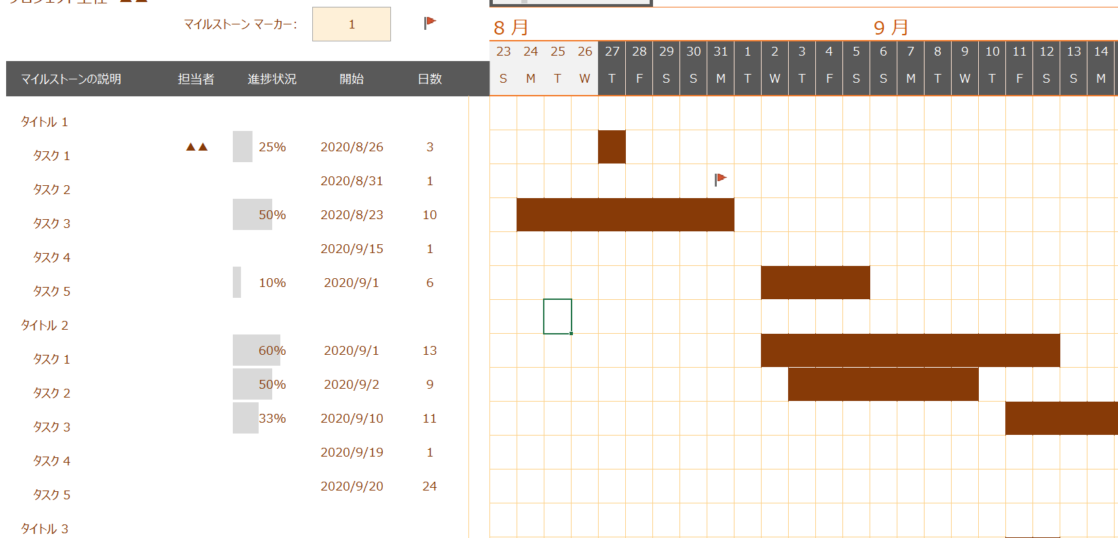
Gantt charts are often used to visually track the progress of a project.
The process is very simple: enter the time on the horizontal axis and the work to be done (hereinafter referred to as "task") on the vertical axis, and then draw a line between the plan and the actual progress.
It may also be called a horizontal road map (héng dào tú) or a strip map (tiáo zhuàng tú).
The Gantt chart allows you to visually check how far you have progressed on a task against your plan.
Gantt charts are especially useful in project management for
- Production control at the factory
- Check workload and availability of personnel
- Check load and availability of machinery and equipment
For example, when used to manufacture some product, it can be used to compare the number of days required for production and the actual production volume with the planned production volume.
good point
- It is a globally recognized form and can be used to check the status of overseas projects.
- No special software or programs are required. If you can use a computer, you can easily make it in Excel.
- Users can easily update their progress.
Bad Points
- Difficult to use for large projects with more than 30 tasks.
- Not suitable for projects where task content changes frequently.
- Once you update it, you will not know what has changed.
Recommended templates for Gantt charts
It is recommended that Gantt charts be created in Excel, where tasks and lines can be easily drawn. It is also a good idea to use free templates distributed on the Internet.
Personally, I'd like to see Microsoft release it for free.templateis recommended.